Setting up Elasticsearch cluster on Kubernetes - Part 1 - Single Node Cluster
This is the begining of a multiple part series of blog posts going through setting up Elasticsearch cluster in kubernetes.
- Part 1 - Setting up Single Node Elasticsearch
- Part 2 - Setting up Kibana Service
- Part 3 - Kubernetes Configuration Files
The main aim of this series of blog posts will be make notes for myself as I try to learn kubernetes and for anyone in the same position.
In this blog post, I will just concentrate on useful Kubernetes getting started resources, commands, and also with an aim of creating a single node Elasticsearch cluster.
Getting Started
I found the most helpful resource for me was the Kubernetes official website for starting to learn kubernetes. Head over to the Interactive Tutorials section of the website and spend time going through all 6 modules to cover the basics. It should only take you 1 - 2 hours. You won’t have to install anything to try it out.
The next step I took was followed the Hello Minikube tutorial. This helped me to get minikube and kubectl commands installed. (Minikube is the local development Kubernetes environment and kubectl is the command line interface used to interact with Kubernetest cluster).
Shaving the Yak!
One or two commands that I use in this post will be mac specific. Reference this guide to get more up to date and OS specific commands.
Once you’ve got the tools all installed, you can now follow along these steps to create a single node Elasticsearch cluster.
If you are using Minikube, make sure that its started properly by running this command (for mac):
minikube start --vm-driver=hyperkit
Now set the Minikube context. The context is what determines which cluster kubectl is interacting with.
kubectl config use-context minikube
Verify that kubectl is configured to communicate with your cluster:
kubectl cluster-info
To view the nodes in the cluster, run:
kubectl get nodes
Kubernetes Dashboard
Minikube includes the kubernetes dashboard as an addon which you can enable.
minikube addons list
returns
- default-storageclass: enabled
- coredns: disabled
- kube-dns: enabled
- ingress: disabled
- registry: disabled
- registry-creds: disabled
- addon-manager: enabled
- dashboard: enabled
- storage-provisioner: enabled
- heapster: disabled
- efk: disabled
You can enable an addon using:
minikube addons enable dashboard
You can then open the dashboard with command
minikube addons open dashboard
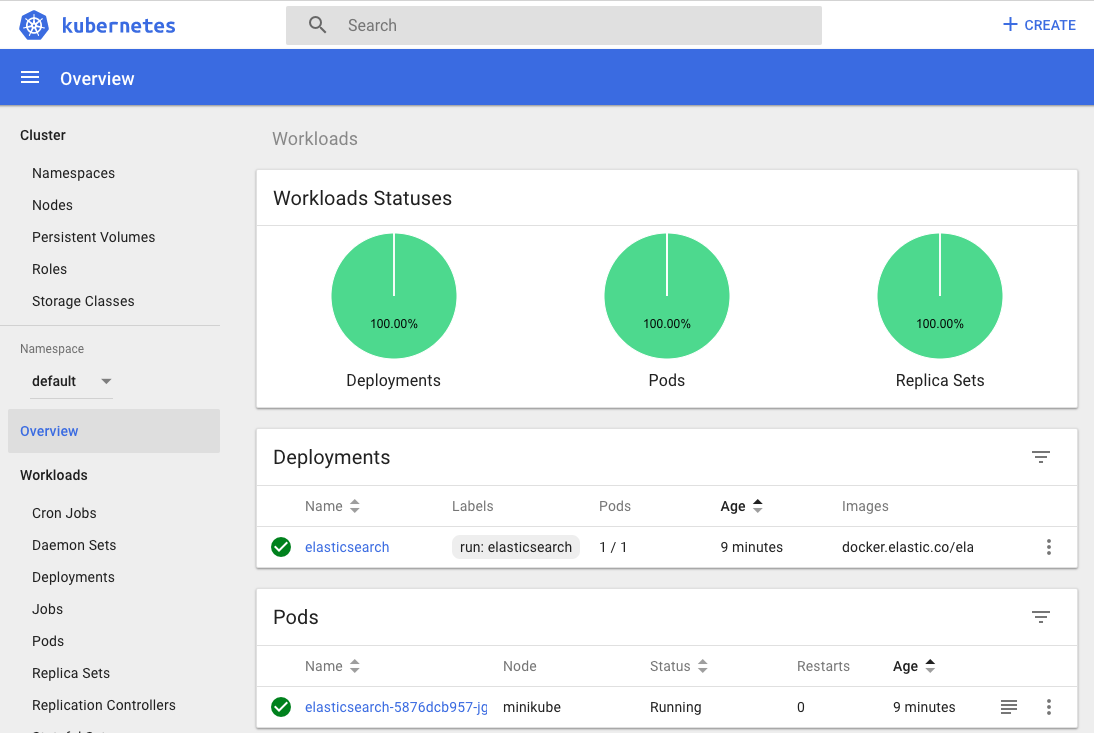
Single Node Elasticsearch Cluster
Let’s start off by creating a single node elasticsearch cluster. According to
the elasticsearch documentation, the current version at the time
of this writing is 6.1.1. And there are three flavours of docker images. We
will just use the basic image which has xpack and free license.
Run the following command to deploy elasticsearch container into our kubernetes
environment exposing just the port 9200. There is no way to expose multiple
ports using the kubectl command line currently. We will probably revisit this
in a later post.
kubectl run elasticsearch --image=docker.elastic.co/elasticsearch/elasticsearch:6.2.1 --env="discovery.type=single-node" --port=9200
To list your deployments use:
kubectl get deployments
To list all pods and watch the container getting created:
kubectl get pods --watch
Save the pod name as a variable for use in later commands.
export POD_NAME=$(kubectl get pods -o go-template --template '{{range .items}}\{\{.metadata.name}}\{\{"\n"}}\{\{end}}')
echo Name of the Pod: $POD_NAME
Note: The above command will not work if you have multiple pods.
Now, you can take a look at the logs using the command:
kubectl logs $POD_NAME
Expose the cluster
We can verify that the cluster is running by looking at the logs. But, let’s check if elasticsearch api is responding first.
In a seperate shell window , excute the following to start a proxy into Kubernetest cluster.
kubectl proxy
Outputs:
Starting to serve on 127.0.0.1:8001
Now, back in the other window, lets execute a curl command to get the
response from the pod via the proxy.
curl http://localhost:8001/api/v1/proxy/namespaces/default/pods/$POD_NAME/
Update - 18 Feb 2019 : In later version of kubernetes, the proxy url is at
http://localhost:8001/api/v1/namespaces/default/pods/$POD_NAME/proxy/
Outputs:
{
  "name": "xNAF2Lj",
  "cluster_name": "docker-cluster",
  "cluster_uuid": "sD73f3CkQJOX3t4sxraSug",
  "version": {
    "number": "6.2.1",
    "build_hash": "7299dc3",
    "build_date": "2018-02-07T19:34:26.990113Z",
    "build_snapshot": false,
    "lucene_version": "7.2.1",
    "minimum_wire_compatibility_version": "5.6.0",
    "minimum_index_compatibility_version": "5.0.0"
  },
  "tagline": "You Know, for Search"
}
Great, everything is working.
Now, lets expose this deployment to outside of Kubernetes network:
kubectl expose deployment elasticsearch --type=LoadBalancer
Pro tip Use MiniKube to open the service in your default browser.
minikube service elasticsearch
In my case, the port that was assigned to this pod was 31389. But, we have
elasticsearch cluster now running in Kubernetes!
Comments
No comments yet. Be the first to comment!
Leave a Comment
Comments will be reviewed before appearing on the site.