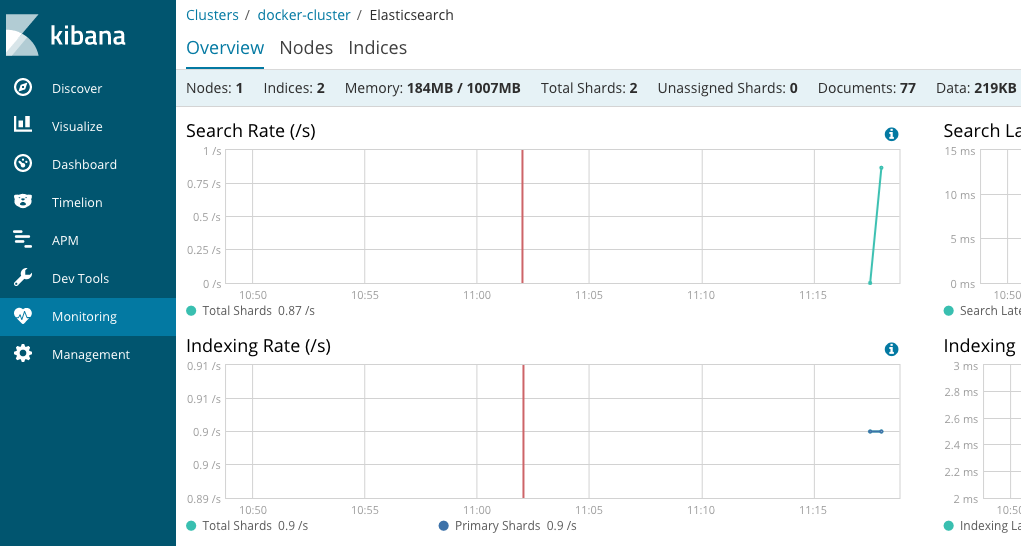
Setting up Elasticsearch Cluster on Kubernetes - Part 2 - Kibana

This is part 2 out of 3 in this series of blog posts.
- Part 1 - Setting up Single Node Elasticsearch
- Part 2 - Setting up Kibana Service
- Part 3 - Kubernetes Configuration Files
Setup Kibana
Let’s try to setup Kibana pointing to our Elasticsearch single node cluster.
kubectl run kibana --image=docker.elastic.co/kibana/kibana:6.2.1 \
--env="ELASTICSEARCH_URL=http://elasticsearch:9200" \
--env="XPACK_SECURITY_ENABLED=true" --port=5601
⚠️ Notice that we have set the ELASTICSEARCH_URL to http://elasticsearch which is the name of our Kubernetes pod. And the environment variable XPACK_SECURITY_ENABLED is set to true. When I tried to run without security enabled, Kibana was stuck on Optimizing and caching bundles for graph, monitoring, ml, apm, kibana, stateSessionStorageRedirect, timelion, dashboardViewer and statuspage. 🤦🏽♂️ You can find more configuration options from their website.
You can see both Elasticsearch deployment and Kibana with the following command:
kubectl get deployments
Outputs:
NAME DESIRED CURRENT UP-TO-DATE AVAILABLE AGE
elasticsearch 1 1 1 1 22m
kibana 1 1 1 0 2m
Pro tip: You can keep watching the progress of your pod creation using the command:
kubectl get pods -w -l run=kibana
If the creation of the pod takes too long, might be to do with the network connection. For me, I had to wait 52 minutes for the image to be pulled down.
kubectl describe pod kibana-556b7764c7-lb4mm
...
Events:
  Type Reason Age From Message
  ---- ------ ---- ---- -------
  Normal Scheduled 52m default-scheduler Successfully assigned kibana-556b7764c7-lb4mm to minikube
  Normal SuccessfulMountVolume 52m kubelet, minikube MountVolume.SetUp succeeded for volume "default-token-dlb49"
  Normal Pulling 52m kubelet, minikube pulling image "docker.elastic.co/kibana/kibana:6.2.1"
  Normal Pulled 2m kubelet, minikube Successfully pulled image "docker.elastic.co/kibana/kibana:6.2.1"
  Normal Created 2m kubelet, minikube Created container
  Normal Started 2m kubelet, minikube Started container
Let’s expose the Kibana deployment as a service:
kubectl expose deployment kibana --type=LoadBalancer
Open Kibana using minikube service kibana.